News Stablecoins
Stablecoin Transfer Volume Q3 2026 Hits $891 Billion in Coinbase Report
Key points
A new analysis of filtered stablecoin activity found $891 billion in adjusted transfers during the third quarter of 2026, with most volume occurring outside traditional banking hours.
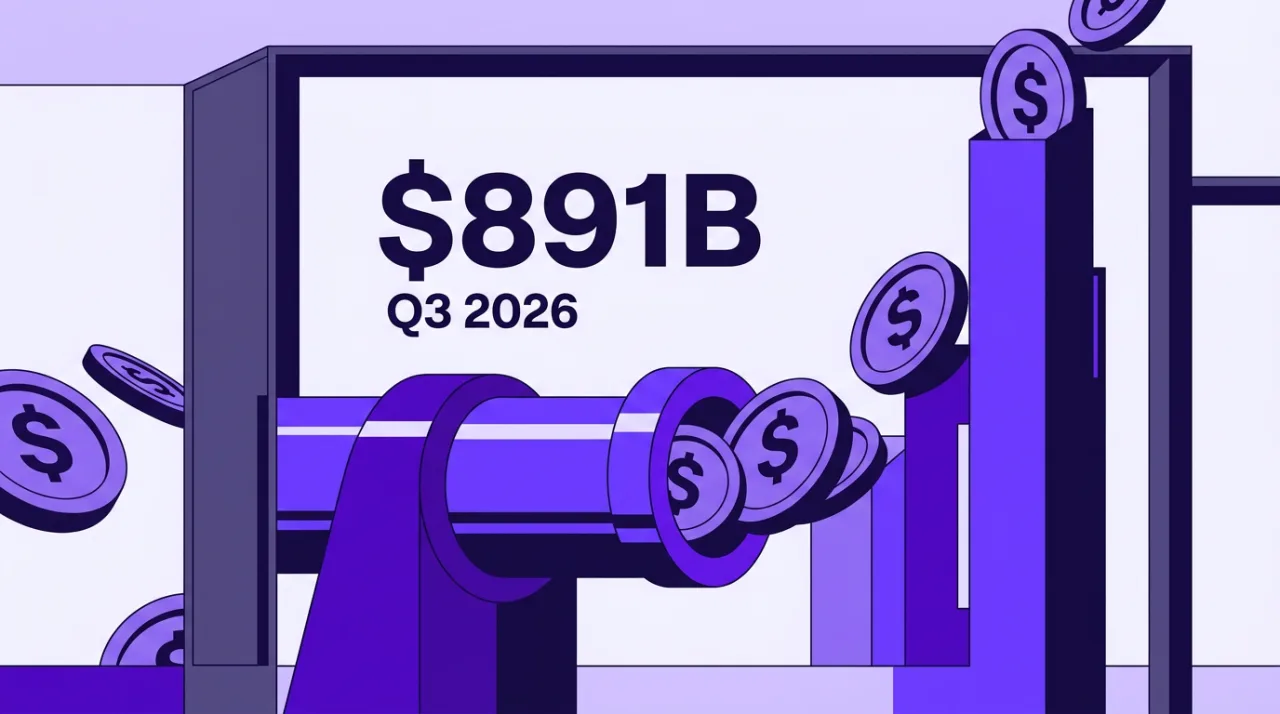
A Coinbase-commissioned report by The Block Pro Research found that adjusted stablecoin transfers reached $891 billion in Q3 2026. The figure, released around October 20, excludes exchange activity, DeFi protocols, bridges, bots and issuance or redemption events. Data came from Allium and covered July through September.
Stablecoin Transfer Volume Q3 2026 Shows Sustained Growth
Adjusted transfers more than quadrupled from $216 billion recorded in Q1 2023. The compound annual growth rate since early 2023 stands near 49.9 percent. The metric isolates organic payments by removing automated and infrastructure-related flows, providing a clearer view of actual economic use.
Volume averaged more than $400 million per hour across the quarter. Market capitalization of stablecoins remained nearly flat in the $301–305 billion range, with year-to-date growth of roughly 0.4 percent. Rising transfer activity therefore reflects higher velocity of the existing supply rather than new issuance.
A separate 12-month analysis ending July 31, 2026, showed that about 73 percent of screened stablecoin volume occurred outside U.S. banking hours. The pattern covers nights, weekends and holidays and underscores the continuous settlement capability of blockchain rails.
Context on Adoption and Infrastructure Use
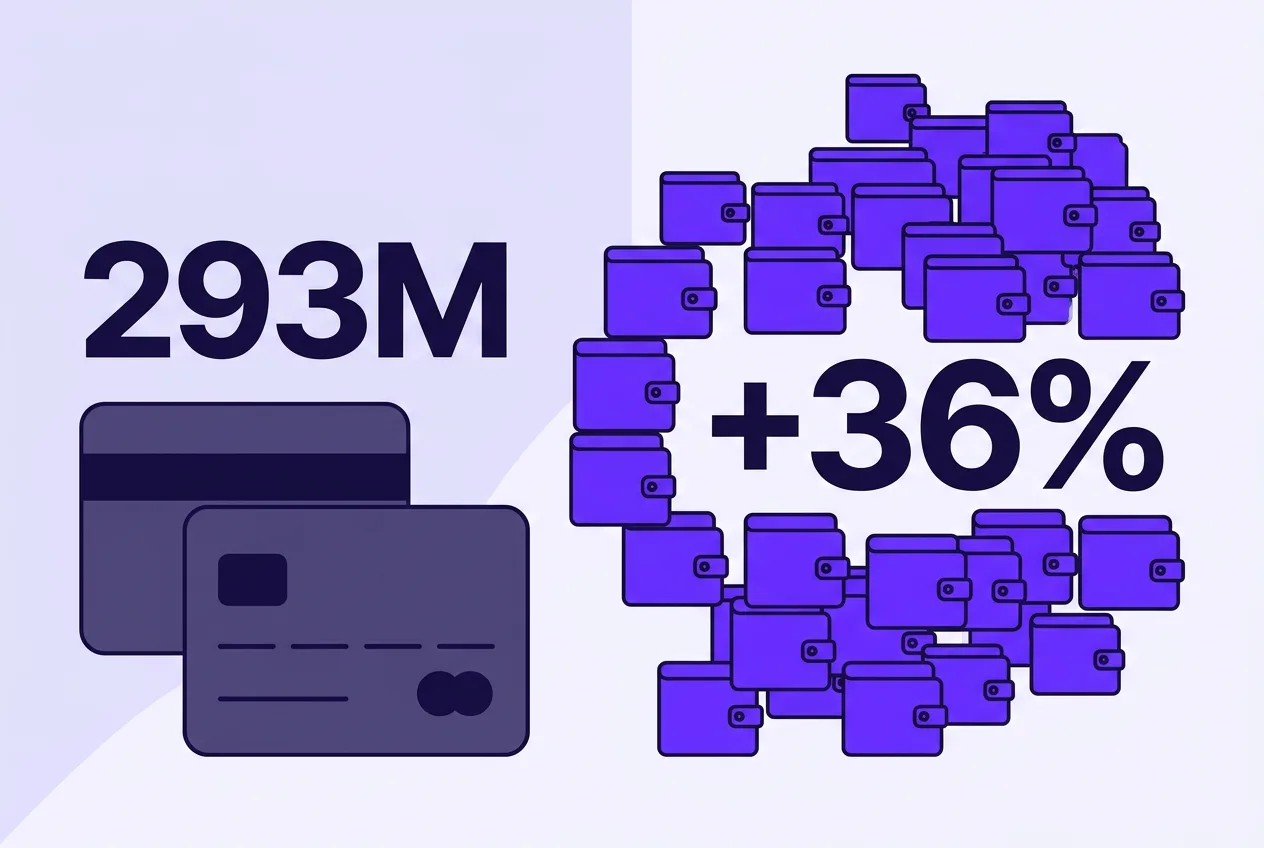
Approximately 293 million blockchain addresses hold stablecoins, exceeding the combined number of American Express and Discover cards issued. B2B payment volume rose 36 percent year over year. Seven of the ten largest U.S. banks have conducted tests with stablecoins or tokenized deposits, while 30 percent of mid-market cross-border firms now use or pilot stablecoin solutions, up from 10 percent in 2024.
One documented example showed a $200 USDC transfer on the Base network cost roughly 86 percent less than comparable traditional payment rails. These figures measure filtered transfer value and do not equate directly to verified merchant spending or unique user counts, as methodologies differ between timing and volume analyses.
The report highlights that stablecoin networks continue to operate without regard to banking calendars. Institutional interest remains focused on settlement speed and cost rather than price speculation, with data drawn from multiple public blockchain analytics sources.
Frequently asked questions
What does adjusted stablecoin transfer volume exclude?
The metric removes transfers involving exchanges, DeFi protocols, bridges, automated bots and minting or redemption events to isolate organic payment activity.
How does stablecoin activity compare to traditional banking hours?
Analysis of the 12 months ending July 2026 found 73 percent of screened volume occurred outside U.S. banking hours, including nights, weekends and holidays.
Why has stablecoin market capitalization stayed flat while transfers rose?
Higher velocity of existing supply drives the increase in transfers, with capitalization remaining near $301–305 billion and minimal year-to-date growth.
Which data sources support the Q3 2026 figures?
The Block Pro Research used Allium data for the adjusted volume calculation and referenced Dune Analytics for timing patterns in the separate 12-month review.
Comments 1